(UNICAMP - 2023- 1 fase)O Coronavirus Resource Cen
(UNICAMP - 2023 - 1ª fase)
O Coronavirus Resource Center (CRC) da Johns Hopkins University é uma importante plataforma de dados sobre a COVID-19, com atualizações frequentes sobre a evolução da pandemia. Os gráficos apresentados nas alternativas que respondem a esta questão foram retirados desta plataforma. Considere, agora, o contexto fictício de uma palestra ministrada em uma universidade estrangeira por um pesquisador brasileiro. Na ocasião, o cientista fez comentários sobre a situação da pandemia no Brasil, valendo-se de dados da plataforma do CRC:
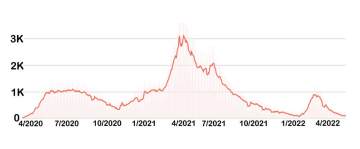
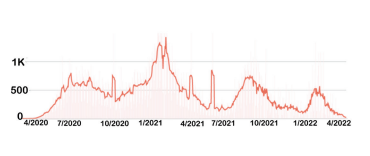
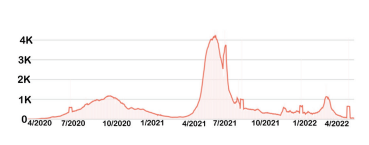
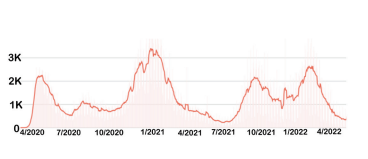
“As I speak now, in June of 2022, I can say we’ve had a tough time during these past two years in our country. This chart, indicating the number of daily deaths over time, shows how we’ve had a couple of months during the pandemic in which the number of daily deaths was over two thousand. Despite having the number of deaths spike to 3 thousand last year – our highest peak to date – levels had been steadily decreasing ever since. This year, though, there was a slight increase in the number of daily deaths, which nearly reached levels attained towards the beginning of the pandemic.”
(Fonte dos gráficos: https://coronavirus.jhu.edu. Acesso em 11/06/2022.)
Qual dos gráficos a seguir ilustraria corretamente a fala do pesquisador?